Reporting
+45 70 22 00 34    This e-mail address is protected from spambots, you need JavaScript enabled to view it    English  

Reporting

Data collection and processing

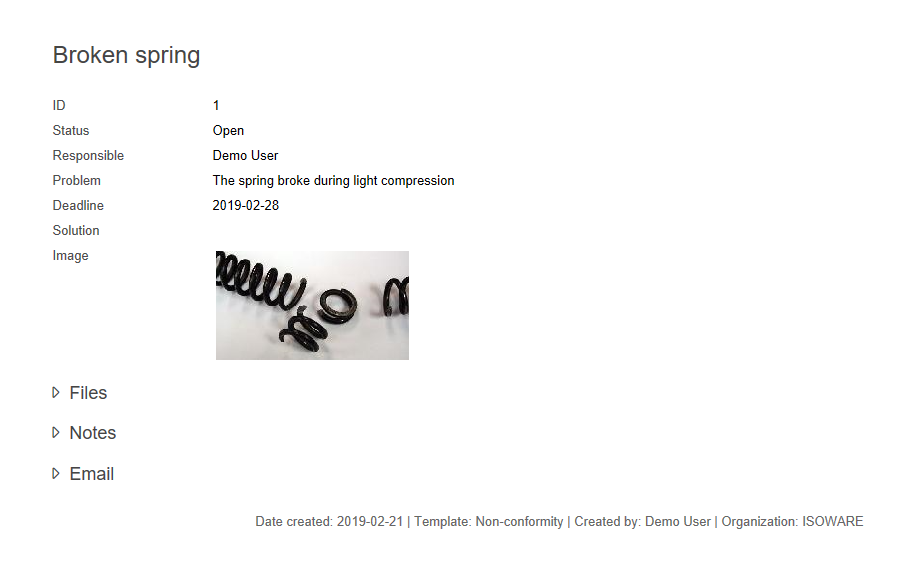
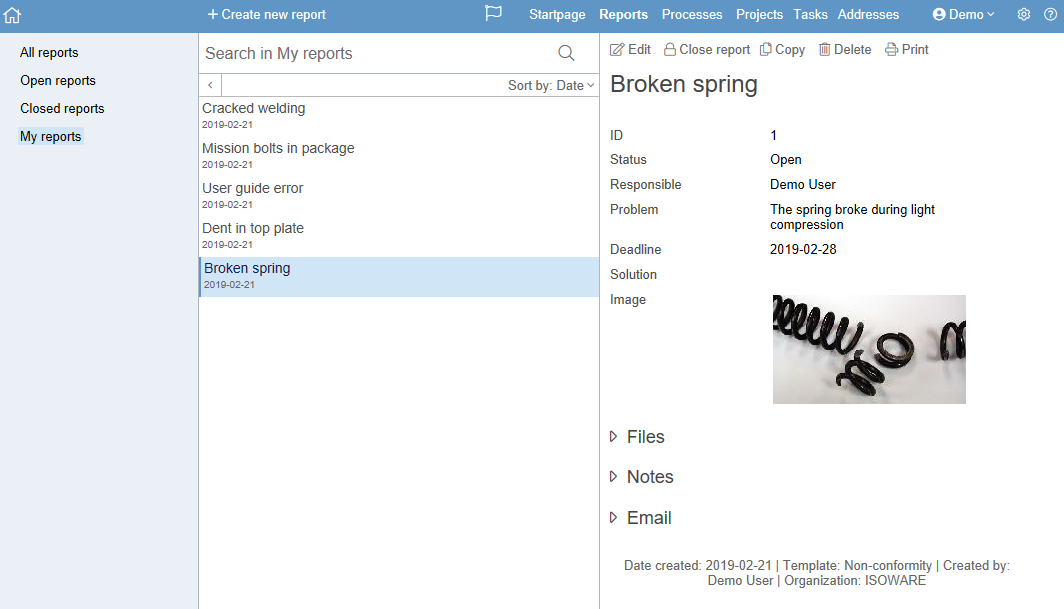
ISOWARE collects important business data on e.g. deviations via the fully configurable report module. An unlimited number of report forms can be created that can be used to collect virtually any kind of data. Report data can be sorted and analyzed in ISOWARE and can also be exported for further processing. This ensures that the company management has the information to make the right decisions.

Report forms

In ISOWARE you can create report forms that contain exactly the fields you want. The forms can be built easily and quickly without any knowledge of programming, everything is graphically based. Below is an example of a completed report:

Report lists

ISOWARE provides some highly effective search tools to sort in the collected data. The data are presented in clear overviews and it is possible to create and save their own listings. Below is an example of a report list:

Any user, with the right to access the report module, can create an unlimited number of lists. The user can choose whether to display a list for all users in the organization or only for the user himself.

Statistics and graphs

A report list can form the basis for the design of graphs using the built-in graph generator Below is an example of a pie chart created on the basis of a report list:

Below is a Pareto diagram created with the same data as the pie chart above.

All report lists can also be exported to spreadsheets for further processing.

Exploiting Existing Data

With ISOWARE's reporting module you can use information from the company's own databases, such as. Navision, Axapta, SAP or similar. Thus you can combine the company's existing data with ISOWARE's database of eg. deviations and incidents.

Follow us